Gold is one of the most precious metals that has been used as a store of value for centuries. That’s why trading gold has become such a popular way to invest in the commodity market.
However, to thrive in trading gold, you need a solid gold trading strategy. Let’s examine three valuable gold trading strategies where you can use to buy and sell gold in financial markets.
This article will also touch on things to consider before trading gold.
Fundamental Strategies
Fundamental trading strategies measure the intrinsic value of gold by its economic and financial factors.
1. Seasonal Gold Patterns
For short-term traders, one of the best fundamental gold trading strategies to follow is seasonal patterns. That’s the beauty of trading gold; gold follows a seasonal pattern and tends to rally during some months.
During these months, gold prices have an above-average price. This pattern is primarily driven by demand for gold during the festive seasons. Festivals such as Diwali and Chinese New Year are traditionally associated with buying gold so gold prices tend to rise in the months leading up. Similarly, gold prices may decline in the summer months when demand for jewelry is typically lower.
2. Inverse Gold Prices and US Treasury Rates
Another fundamental strategy for trading gold CFDs is to monitor the inverse relationship between gold prices and US Treasury rates.
If you have a long-term trading outlook, using US Treasury rates can be an alternative strategy. These rates usually trigger an inverse response from gold prices as most traders will liquidate their assets to purchase treasury bonds.
So, gold prices tend to move downwards whenever the treasury rates increase. And whenever the treasury rates decrease, the price of gold increases.
When interest rates are low, investors may be more inclined to hold onto gold as a store of value. On the other hand, when interest rates are high, investors may be more inclined to invest. In these cases, gold traders would opt for bonds or other fixed-income assets, which offer a higher rate of return.
By monitoring this relationship between gold prices and US Treasury rates, traders can identify potential trading opportunities based on interest rate fluctuations.
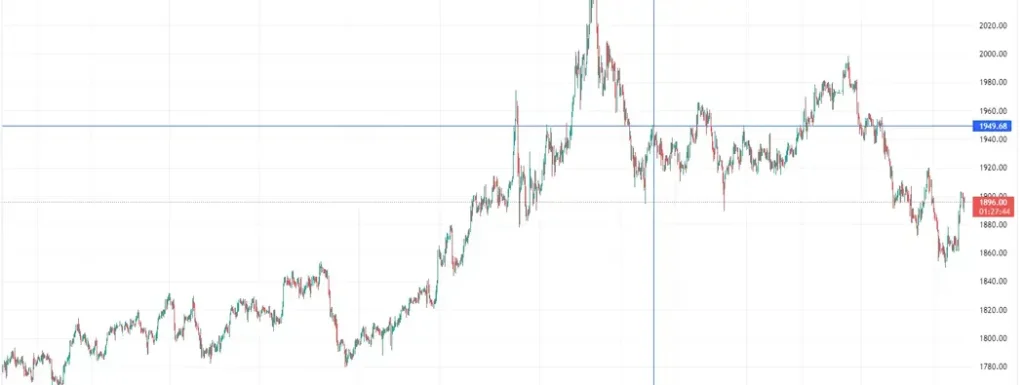
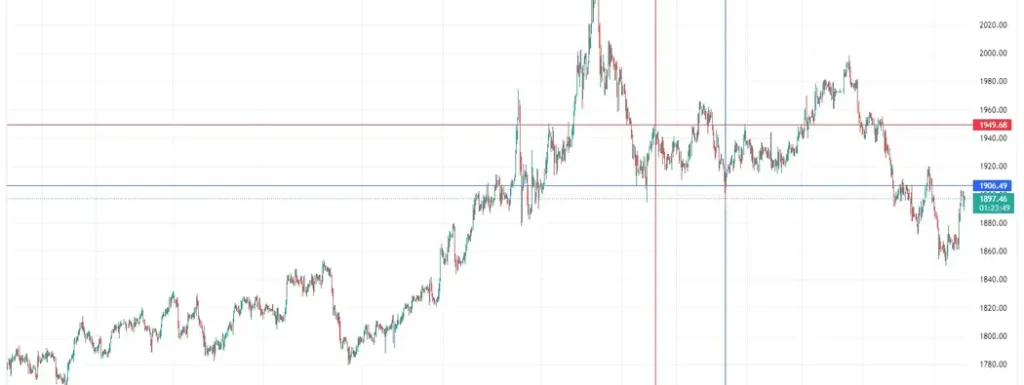
For example, when the US treasury yield rose on Thursday, 17 March 2022, the gold prices dropped below $1946. [1]

Although it hit that price again a few days later, it dropped below the resistance at $1925.

Technical Strategies
Experienced traders often use technical analysis strategies as a guide to analyze gold price charts. It requires advanced knowledge of technical analysis tools to identify patterns or trends that can help predict future price movements.
Technical analysts use a combination of indicators such as moving averages, relative strength index (RSI), and the stochastic oscillator to identify entry and exit points.
To use technical analysis to trade gold CFDs, ensure your strategy matches the current market conditions. Momentum strategies tend to work well in trending markets, while range strategies work best in low-volatility markets [2][3].
The Moving Average Crossover
A simple Moving Average (MA) indicator is the average closing price for a traded security, often over 20 days. Gold traders also use the 50-day and 100-day MA.
So how does the Moving Average Crossover work?
It involves plotting two MA of different periods on a price chart and looking for a crossover point where the two lines intersect. Whenever the short-term MA crosses the long-term MA, that’s a signal for a possible long position on a gold trade. Whenever the short-term MA falls below the longer-term MA, that’s a signal for a possible short position.
Let’s look at an example below.

For example, you’re in a hypothetical gold position as you use the 100-day MA.
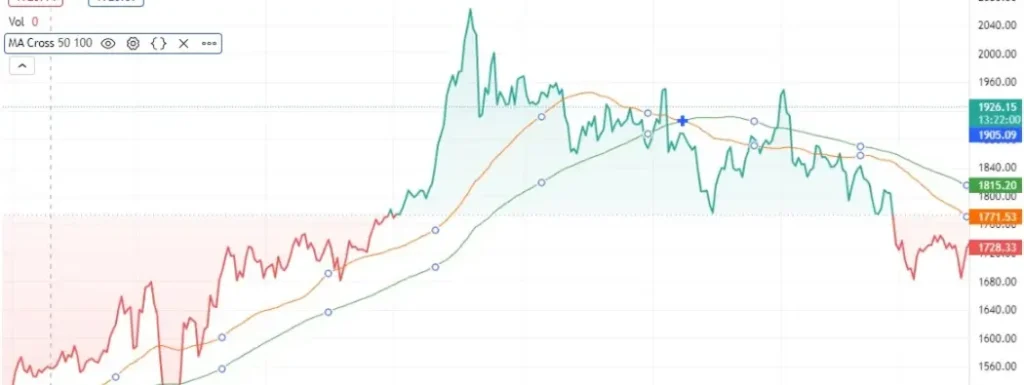
Whenever the 50-day MA crosses the 100-day MA, you could take a long position on the trade. Once the short-term MA falls below the long-term MA that signals a possible short position.
As shown by the MA cross above, gold enjoyed one of the biggest rallies during the 2020 pandemic. [4]
In April 2020, the 50-day MA crossed the 100-day MA, and prices soared over several months until November 2020. Gold in 2020 was observed to hit highs of up to 25% [5].
4 Things to Consider Before Trading Gold CFDs
Here are four key things you should consider before trading gold:
1. Find Out What Moves Gold
Market forces have a direct impact on the price of gold.
These forces directly affect the trade volumes, trade intensity, and market sentiment of gold. They include:
- Emotions (Greed and Fear)
- Supply and Demand
- Inflation and Deflation
- Government Policy
Supply and demand, for example, have played a significant role in the price of gold over the past couple of years.
According to the World Gold Council, the annual demand for gold rebounded in 2021, recovering from many of the losses incurred during the 2020 pandemic. Because of this sharp increase in demand from institutional investors, the prices of gold bars and coins shot up to levels not seen since the 2nd quarter of 2019. [6]
That wasn’t true, however, for every gold instrument. As some shot up, others dropped. Take Gold ETFs, for instance. An increase in interest rates and inflation across western markets made it expensive to hold them, leading to an outflow of capital from Gold ETFs into other assets.
Failure to understand these forces can expose you to massive market risk as a retail trader. That happens when you trade on one sentiment when, in fact, another controls the market.
2. Understand the Market Participants
Gold attracts multiple market participants, each with opposing interests. In other words, everyone in the gold markets has their reasons for participating. Understanding these interests can help you determine how to trade gold and which gold instrument to choose.
Most times, ‘gold bugs’, or investors with a bullish outlook on gold are at the top of the pyramid. These investors purchase actual gold bullion and other gold assets. Gold bugs traditionally hold long positions, sometimes perpetually, and are rarely shaken by downtrends. [7]
Although their actions elbow out shorter-term market players, gold bugs create enormous market liquidity and provide opportunities for others to get out of their gold stocks and futures positions.
Gold also makes for an excellent hedging instrument, and most institutional investors will use risk-on and risk-off strategies, especially in markets with lower retail trader participation.
3. Observe for Long-Term Gold Trends
Gold has a rich history. Take time to go through historical gold charts and understand its behaviour over the past century.
Trend watching can also help you identify patterns that gold has followed over recent decades.
4. Choose Where to Trade
Once you understand these three factors, you can choose where to trade. Doing this provides you with an opportunity to select a gold CFD instrument to trade and plan your entry and exit points.
At the same time, liquidity follows gold trends, especially during upwards or downward movements. Markets with lesser participation are less liquid and have much lower participation rates. Often, they’ll force higher trading costs on you through slippage.
Conclusion
Trading gold requires patience, discipline, and a long-term outlook on gold strategy. Although there are plenty of gold trading strategies, consider getting started with these three first.
To recap in short, fundamental strategies help analyse market statuses. While a technical strategy enables you to time your entry and exit out of any gold positions.
Whichever strategy you prefer, it’s essential to reflect on market forces, risk management, and your personal financial goals before trading gold. And remember, past performance is not an indication of future results.
So choose the right strategy that fits your trading style and trading gold can be a profitable investment. Happy trading!
References
- “Gold Price Chart – Trading Economics”. https://tradingeconomics.com/commodity/gold . Accessed 8 Apr 2022.
- “The Trend is Your Friend: Time-Series Momentum Strategies Across Equity and Commodity Markets – The University of Manchester”. https://pure.manchester.ac.uk/ws/portalfiles/portal/39718724/The_Trend_is_Your_Friend_Time_Series_Momentum_Strategies_Across_Equity_and_Commodity_Markets.pdf . Accessed 8 Apr 2022.
- “How to Build a Winning Range-Bound Trading Strategy – Investopedia”. https://www.investopedia.com/ask/answers/011215/how-do-i-effectively-create-rangebound-trading-strategy.asp . Accessed 8 Apr 2022.
- “XGDU Stock Fund Price and Chart – TradingView”. https://www.tradingview.com/chart/?symbol=TVC%3AGOLD . Accessed 8 Apr 2022.
- “Rate of return of gold as an investment from 2002 to 2022 – Statista”. https://www.statista.com/statistics/274002/return-on-gold-as-an-investment-since-2002/ . Accessed 8 Apr 2022.
- “Gold demand hits highest level in more than two years – World Gold Council”. https://www.gold.org/news-and-events/press-releases/gdt-full-year-2021-press-release . Accessed 8 Apr 2022.
- “Gold Bug: What It Is, How It Works, Example – Investopedia”. https://www.investopedia.com/terms/g/goldbug.asp . Accessed 8 Apr 2022.


