Nvidia tops forecasts and boosts US stock futures

Headlines
* Nvidia reports 600% profit explosion and stock split, stock rallies 6%
* FOMC minutes indicate worries over lack of inflation progress
* UK PM Sunak takes gamble by calling UK general election for 4 July
* Sharp drop in UK CPI presents a conundrum for UK policymakers
FX: USD advanced higher towards the 50-day SMA is at 104.91. The FOMC minutes showed evidence of increasing concern around the disinflation story – no surprise. Many also questioned whether policy was restrictive enough to lower inflation.
EUR dipped yesterday, negating the bullish flag pattern that looked like developing. PMIs are released later today. ECB President Lagarde recently reiterated her cautiously dovish stance. A June rate cut is a done deal. but markets have started to price out further reductions, with 66bps of cuts for this year versus 75bps a week ago.
GBP jumped on stronger than expected CPI data though gave back gains late on. The headline and core figures fell but missed expectations. Crucially, the key metric for the BoE, services inflation, was way hotter than estimates at 5.9% versus 5.5% and the bank’s own forecast. A June rate cut has been priced out with odds on an August one halved to around 50%. Bulls are eyeing up 1.2828.
USD/JPY inched north as buyers aim for the May peak at 156.78. Support sits at 156.03. Japan inflation data is released on Friday morning.
AUD sunk below recent support around 0.6650 towards the next key level at 0.6616. USD/CAD ticked up above the 50-day SMA at 1.3641. A dip in April CPI saw bets on a June rate cut increase to 60% from around 50% before the data release. NZD outperformed on a more hawkish stance by the RBNZ. It said it could resume rate hikes and pushed out cuts to late next year. Markets had been predicting a possible October rate reduction. But the kiwi gave up a lot of its gains after spiking up to 0.6152 and settling below 0.61.
Stocks: US equities ticked lower in quiet trade ahead of Nvidia earnings.. The S&P 500 closed 0.27% lower at 5306. The tech-heavy Nasdaq 100 lost 0.05% to finish at 18,705 The Dow Jones settled down 0.51% at 39,671. There were mixed signals with strong UK CPI data and a more hawkish RBNZ together with FOMC minutes and less dovish FOMC minutes. Target, a consumer bellwether, missed earnings on s sales decline and dropped 8%. Prices are hovering around recent all-time highs.
Asian Stocks: APAC futures are mixed. Asian stocks were subdued and mostly rangebound. The ASX 200 was helped by strength in heavy industries. The Nikkei 225 underperformed on mixed data as it dipped below 39,000. The Hang Seng and Shanghai Comp were varied with the Hang Seng more buoyant with XPeng leading gains. Ongoing trade frictions hindered the mainland.
Gold turned sharply lower after spiking to all-time highs at the start of the week. China gold imports slumped 30% m/m and was the lowest total for the year in the face of record prices.
Day Ahead –PMIs and Eurozone Wage Negotiations
Today’s May business activity numbers are expected to reinforce the brighter global economic outlook. The composite figures should stay on the right side of the 50 mark which denotes expansion and contraction. A slow euro area recovery appears to be underway after six consecutive quarters of stagnant growth. Estimates for the zone are for a modest uptick with the composite moving further toward 52. Services will drive the improvement helped by an imminent June ECB rate cut. An outsized set of data could move the dial for cuts beyond next month.
We also get to see the region’s negotiated wage growth in Q1 stemming from collective bargaining exercises. Economists’ estimates are significantly different even with some countries having already reported. They range from 4 to 4.5% y/y. The upper end of that range would show sticky wages compared to the prior quarters and would be significantly faster than the Q1 gain from last year. This could underpin support for the euro.
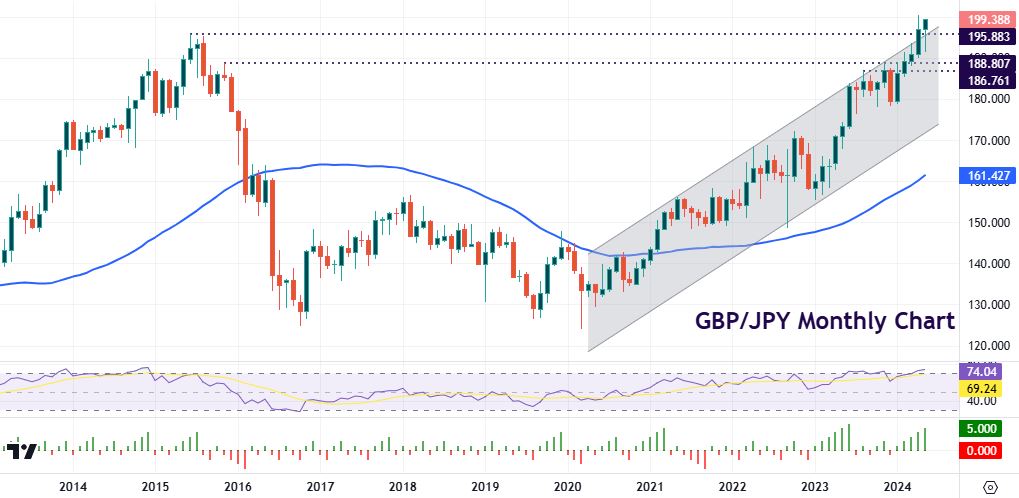
Chart of the Day – 200 beckons for overbought GBP/JPY
This pair has been on a multi-year bull trend since 2020. We’ve seen a series of higher highs and higher lows in a relatively neat ascending channel. Lows below 130 are now a distant memory with the cross approaching 200. Those prices were last seen in 2008.
But the non-stop buying this year, with so far five months of straight gains has taken prices outside the upper channel. The spike high from April is at 200.53. Prices are overbought on several measures.

